Falling correlations point to rising opportunities for active managers
Several investment strategists in our network are producing research highlighting a relatively new phenomenon for this market cycle: falling stock correlations.

The investment implications of this changing dynamic go beyond asset allocation to the relative merits of the investment vehicles used to implement asset allocation decisions. In theory, falling correlations should lead to a more beneficial environment for active portfolio managers by signaling that individual stocks are reacting to idiosyncratic drivers of returns and company fundamentals rather than macro factors such as central bank policy.
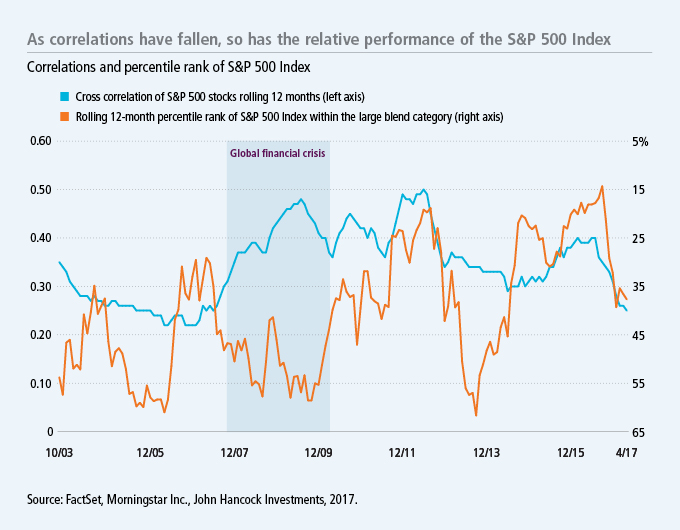
To test whether falling correlations are, in fact, associated with better performance for active managers, we charted rolling 12-month cross correlations of S&P 500 Index stocks and overlaid the percentile rank of the S&P 500 Index's performance within Morningstar's large blend peer group of actively managed funds.

One observation made by our network strategists is that the 2008 global financial crisis marked a dividing line between two correlation regimes in U.S. equities. In the post-crisis regime, stock cross correlations jumped and remained roughly 10% higher than in the pre-crisis regime. This may well be due to the powerful effect that macro influences—such as quantitative easing and other central bank policies—had on the market, generally boosting stocks across the board. The market-cap-weighted S&P 500 Index has been a tough bogey for the large blend active managers to beat during this post-crisis period. In fact, the index hit a 15-year record this past September for rolling 12-month returns versus the large blend category, ranking in the 14th percentile (86% of actively managed funds in the category failed to beat it). The dominant performance of index-based strategies has had a predictable effect on industry fund flows.
More recently, the dramatic decline in cross correlations highlighted by our strategists has coincided with a decline in the relative performance of the S&P 500 Index. The decline in the index performance to the 38th percentile through April suggests that 24% more active managers have been able to beat the S&P 500 Index during the past 12 months than in the 12-month period ended September 2016. In fact, at 0.25, S&P 500 Index cross correlations have reached their lowest level of this cycle and are now in line with their average level prior to the 2008 global financial crisis.1 These falling correlations also coincide with a more deliberate pace of monetary policy normalization by the Fed.
While the Fed is slowly stepping away from supportive monetary policy, macro strategists in our network believe corporate fundamentals are likely to become increasingly influential on stocks. First-quarter earnings season was a testament to the market's newfound reliance on fundamentals as stocks rose sharply on reports of robust year-over-year earnings growth of 13.7%. With that said, the earnings improvement for the quarter was not uniform. On a sector basis, there was a meaningful dispersion of earnings growth, from a 5% decline for telecommunication services to financials, which was one of the top sectors with 18.7% growth. As corporate fundamentals continue to diverge and monetary policy becomes less relevant, stock selection will likely become increasingly important.
These developments bear watching, and the investment strategists in our network are seeing changing dynamics within the equity market that could suggest better opportunities for active stock picking.
1 FactSet, Morningstar Inc., John Hancock Investment Management, as of 6/22/17.
Important disclosures
Important disclosures
Quantitative easing (QE) is a monetary policy in which a central bank purchases government debt or other fixed-income securities in an effort to lower interest rates, increase the money supply, and stimulate economic growth. Correlation is a statistical measure that describes how investments move in relation to each other, which ranges from –1.00 to 1.00. The closer the number is to 1.00 or –1.00, the more closely the two investments are related.
The S&P 500 Index tracks the performance of 500 of the largest publicly traded companies in the United States. It is not possible to invest directly in an index.
MF379961


