September's volatility—part seasonal, part fundamental
After a two-month spell of extremely low volatility in July and August 2016, inclement weather has crept back into the markets.

Elevated volatility is nothing new for this time of year; in fact, over the past 25 years, on average, September has been the second worst month of the year for the S&P 500 Index and has delivered the largest spikes in volatility as measured by movements in the Cboe Volatility Index (VIX). According to Bloomberg data, over the past 25 years, the S&P 500 Index returned an average of –0.3% in the month of September, while the VIX moved 8.8% higher.1 Today, we're only halfway through September and the VIX has already moved from a low of 12 to a high of 18.2 The key questions for investors: Is the volatility this September justified and should equity allocations be altered as a result?
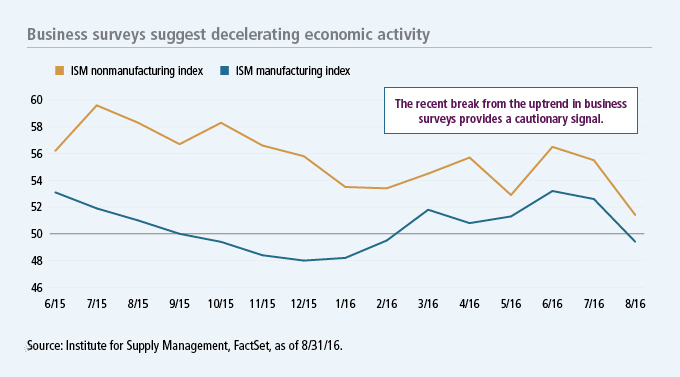
To start, our network of asset managers and researchers has pointed out that there are legitimate concerns in the sources of today's volatility, the most valid being August business surveys that represent a potential drop in economic activity. The Institute for Supply Management releases their manufacturing and nonmanufacturing indexes each month to provide insight into the health and underlying trends of U.S. business activity. The August reports showed that manufacturing went from an expansionary reading in July (above 50) to a contractionary reading in August (below 50). The manufacturing index had bottomed in January 2016 at 48, but then bounced to as high as 53 in June before dropping back to 49 in August. The nonmanufacturing index similarly peaked in June and has fallen to its lowest level since 2010, at 51.3 While these readings still suggest expansionary activity in aggregate, it's clear that business activity has slowed meaningfully.

The Fed to provide breathing room
The counterbalance to slowing business activity is that the U.S. Federal Reserve (Fed) will likely take this recent economic data into consideration and push out the timetable for raising rates. The Federal Open Market Committee members have had plenty of airtime over the past several weeks and have provided mixed signals on the course of rate hikes, which has contributed to September's uptick in volatility. With the next Fed meeting coming up on September 21, investors will get greater clarity soon. Fed fund futures data now suggests that there's only a 20% chance of a 25 basis point rate hike. Those odds have dropped by half since the start of September when they were as high as 40%.4 As long as the Fed is patient in tightening monetary policy, our network believes risk assets, most notably equities, should continue to grind higher—albeit with bumps along the way.
Risks on the horizon, but long-term investors are likely to be rewarded
There's no shortage of potential volatility-inducing events in the months ahead, including the upcoming U.S. presidential elections, a likely Italian referendum, and the possibility of Britain triggering Article 50 related to its exit from the EU. Any one of these events has the potential to rattle markets. That said, our network broadly believes that investors should stay the course with their U.S. equity allocations. With a dividend yield just north of 2% on the S&P 500 Index3 and earnings growth appearing to be bottoming, stocks could have modest tailwinds heading into 2017. Current valuations—the S&P 500 Index currently trades at 20 times trailing 12-month earnings4 —suggest muted equity returns in the range of 4% to 6% over the longer term. This may not sound like much, but compared with the low starting yields on bonds, it very well may be worth the risk.
1 Bloomberg, 1/1/91–12/31/15. Seasonal data is from the earliest common period for the S&P 500 Index and the VIX. 2 FactSet Reasearch, 2016. 3 Institute for Supply Management, FactSet Research, as of 9/14/16. 4 Bloomberg, as of 9/14/16. Fed fund futures data is from the world interest-rate probability function.
Important disclosures
The S&P 500 Index tracks the performance of 500 of the largest publicly traded companies in the United States. The Chicago Board of Options Exchange (Cboe) Volatility Index (VIX) shows the market's expectation of 30-day volatility using the implied volatilities of a wide range of S&P 500 Index options. The ISM manufacturing index monitors employment, production, inventories, new orders, and supplier deliveries. A composite diffusion index monitors conditions in national manufacturing and is based on the data from these surveys. The ISM nonmanufacturing index uses information collected from surveys from over 400 nonmanufacturing companies. An index with a score over 50 indicates that activity is expanding, and a score below 50 shows contraction. Price-to-earnings (P/E) ratio is a valuation measure comparing the ratio of a stock's price with its earnings per share. Past performance does not guarantee future results.
This commentary is provided for informational purposes only and is not an endorsement of any security, mutual fund, sector, or index. No forecasts are guaranteed. The information contained here is based on sources believed to be reliable, but it is neither all inclusive nor guaranteed by John Hancock Investment Management. This information may contain certain statements that may be deemed forward-looking statements. Please note that any such statements are not guarantees of any future performance and actual results or developments may differ materially from those presented or discussed.
Fixed-income investments are subject to interest-rate and credit risk; their value will normally decline as interest rates rise or if an issuer is unable or unwilling to make principal or interest payments. Investments in higher-yielding, lower-rated securities include a higher risk of default. Foreign investing, especially in emerging markets, has additional risks, such as currency and market volatility and political and social instability.
MF318277


