Risk aversion rises as a flattening yield curve flirts with inversion
The U.S. Treasury yield curve—the term structure of interest rates on offer from government securities of differing maturities—has flattened in recent days, with implications rippling throughout the global capital markets.

Slowing growth in economies overseas, a lack of substantive progress on a U.S.-China trade agreement, volatile equity prices, and moderating domestic inflationary pressures have driven investors toward government bonds on the longer end of the yield curve, weighing down the yields on those longer bonds as their prices get bid up. Meanwhile, yields on short-term U.S. Treasury bills maturing in less than one year have actually risen in recent weeks.
Why investors should care if the yield curve inverts
This flattening of the yield curve may in itself be cause for concern. While the U.S. economy remains on solid footing, the rising risk of a yield curve inversion—shorter-term bonds (those maturing in 2 years or sooner, for example) offering higher rates of interest than longer-term bonds (maturing in 10 years or longer), historically a harbinger of an economic recession—suggests many investors are now more inclined to counter equity market risk by dialing up exposure to duration, the interest-rate risk embedded in longer-term government bonds. Duration has remained a rare—and relatively reliable—source of returns during moments of stress in riskier asset markets.
This drive toward longer duration represents a sharp reversal. Until recently, investors had been wary of interest-rate risk, piling into the shortest segments of the yield curve with proceeds redeemed from intermediate-term bond funds; in fact, Morningstar’s ultra-short bond fund category gained a record $11 billion of net inflows in October as the intermediate bond fund category lost $17 billion in net outflows.1 But more recent movements in the credit, equity, and interest-rate markets suggest investors are now more inclined to take cover in longer duration government bonds.
For the moment, the bond market is still pricing in a 78% probability of a 0.25% rate hike at the U.S. Federal Reserve’s (Fed's) final Federal Open Market Committee (FOMC) meeting this year, on December 19.2 However, the Fed’s forward guidance might be of even more interest to investors. Will the new dot plot reveal that FOMC members remain confident in 2 to 3 more rate hikes this cycle—or will they drop their expectations to 1 to 2 more hikes? The spread between yields on 2-year and 10-year U.S. Treasury notes hinges on the meeting’s outcome: If the market thinks the Fed is inclined to continue hiking at a relatively hawkish pace, the risk of 2-year yields rising above 10-year yields—the most commonly accepted definition of a yield curve inversion—is likely to rise. At that point investors are likely to see more frequent references to the R-word—recession—in the headlines.
How soon might the cycle turn if and when the yield curve becomes inverted?
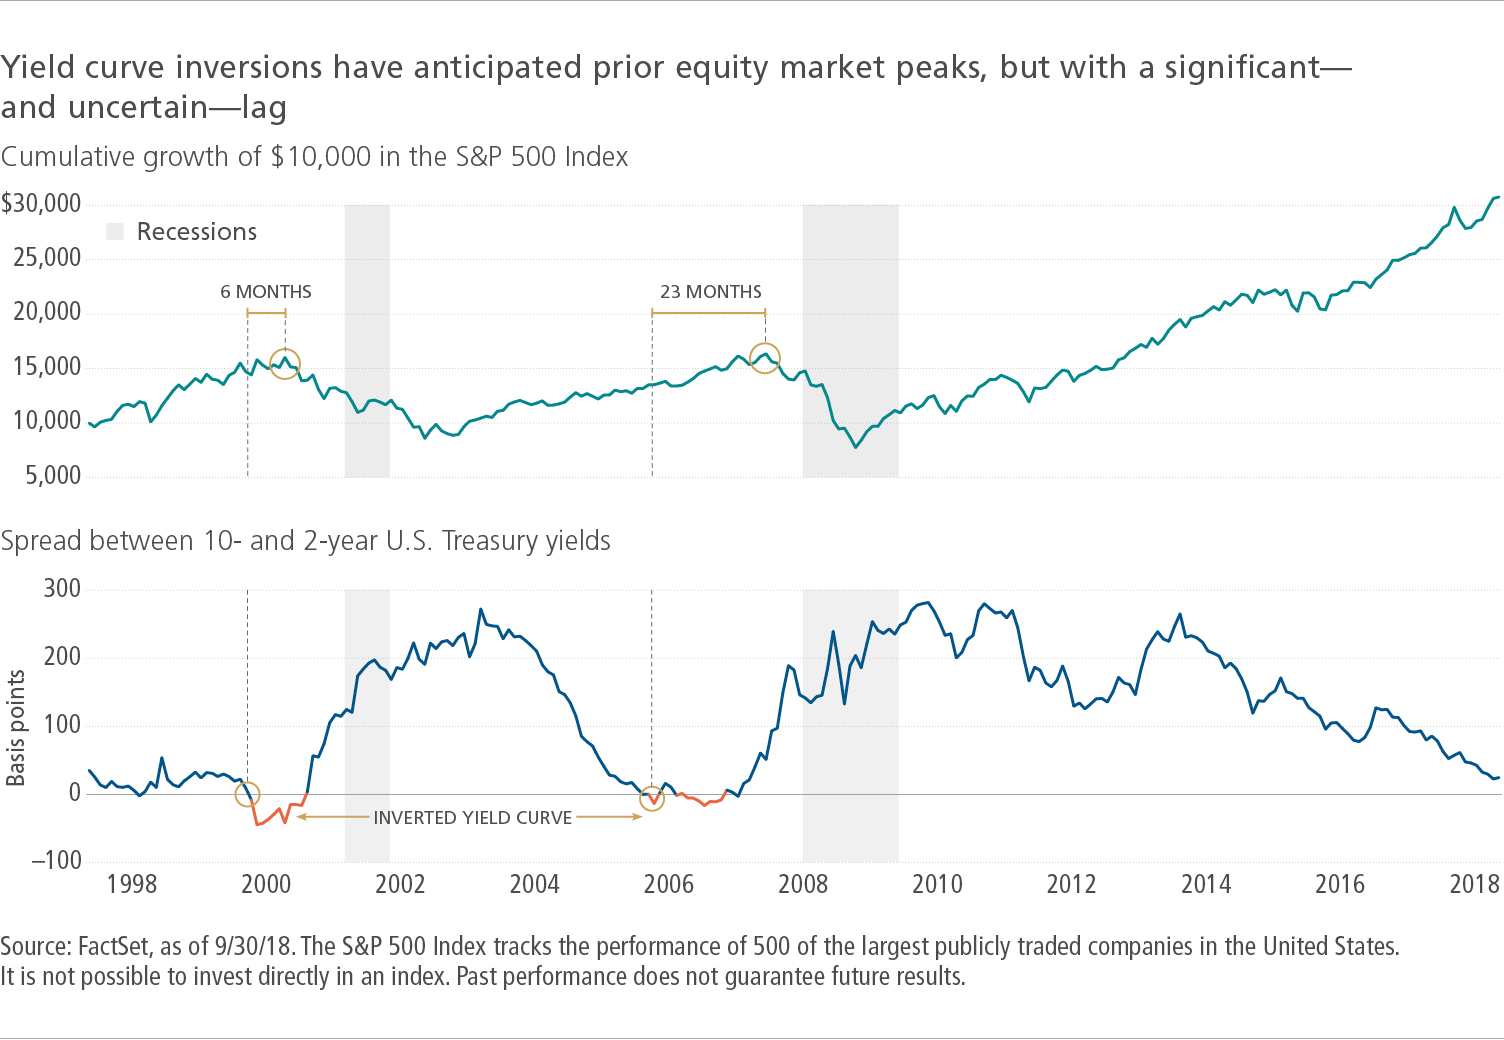
In past cycles, an inverted yield curve has served as an early warning sign of an economic recession; equity markets, in many of those cases, have continued to grind higher following a yield curve inversion, sometimes for months—or longer. The yield curve first inverted six months ahead of the S&P 500 Index’s peak in 2000, and it inverted nearly two full years before the 2007 market peak.2 History would suggest that we’re still relatively early in this admittedly late phase of the market cycle. As a result, we’re reluctant to pare equity exposure at this juncture, as U.S. economic data remains relatively robust.

What to do if the yield curve inverts—and how to prepare in the meantime
Instead, we think it makes sense to shift within the fixed-income portion of an investment portfolio, extending its duration by trimming shorter-term bond exposure and adding to longer-term bond exposure. Investors may also do well increase the credit quality of their bond portfolios, trimming higher-yielding corporate bonds and adding exposure to government debt. Data from Morningstar reveals that higher-quality intermediate- and longer-duration bonds did better than lower-quality shorter-duration fixed income, and better than equities, in the months following last two yield curve inversions.1
Asset prices and the shape of the yield curve have been changing quickly as expectations about this month’s Fed meeting change. The bond portion of your portfolio needs to provide ballast when riskier asset classes struggle. We expect high-quality duration to remain one of the most reliable ways to keep that ballast intact.
1 Morningstar Direct, as of 12/6/18. 2 FactSet, as of 12/6/18.
Important disclosures
Important disclosures
Views are those of Emily R. Roland, CIMA, head of capital markets research, and Matthew D. Miskin, CFA, market strategist, for John Hancock Investment Management, and are subject to change. This commentary is provided for informational purposes only and is not an endorsement of any security, mutual fund, sector, or index. This material does not constitute tax, legal, or accounting advice, and neither John Hancock nor any of its agents, employees, or registered representatives are in the business of offering such advice. Please consult your personal tax advisor for information about your individual situation. No forecasts are guaranteed, and past performance does not guarantee future results.
MF687205


